|
EFFECTS OF COVID-19 1 The
Effects of COVID-19 and Mental Health Jared A. Cole University of
North Florida SOP3214C |
|
Methods |
|
Participants |
 The
research design used was a between subjects design. A total of 50
(N=50) participants were chosen to take a depression inventory to
gather data. 25 of the participants were between the ages 20-38
while the other 25 of the participants were 39 and up. All
participants were chosen using non-probability convenient sampling
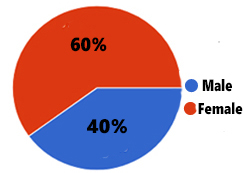
techniques and were not chosen equally. After data was gathered, 60%
of individuals were female and 30% were recorded as male
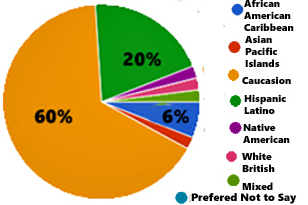
(Table 1). Ethnicities that were
recorded included; 66% of participants being Caucasian, 20%
Hispanic/Latino, 6% African American/African/Black/Caribbean, 2%
Native American, 2% Asian/Pacific Islander, and 2% Mixed, and
2%White British
(Table 2). The
research design used was a between subjects design. A total of 50
(N=50) participants were chosen to take a depression inventory to
gather data. 25 of the participants were between the ages 20-38
while the other 25 of the participants were 39 and up. All
participants were chosen using non-probability convenient sampling
techniques and were not chosen equally. After data was gathered, 60%
of individuals were female and 30% were recorded as male
(Table 1). Ethnicities that were
recorded included; 66% of participants being Caucasian, 20%
Hispanic/Latino, 6% African American/African/Black/Caribbean, 2%
Native American, 2% Asian/Pacific Islander, and 2% Mixed, and
2%White British
(Table 2).
|
Procedure
The CES-D questionnaire will be distributed via
email and other forms of communication over the internet to each
person individually. Each participant was chosen using a
non-probability convenient sampling procedure and were not chosen
equally. Before the questionnaire was distributed, participants were
asked to read and sign an informed letter of consent that was
approved by the research advisor.
Tactics were used to make sure that the participants felt
comfortable and felt like the research that was being investigated
was explained clearly and concisely. Each participant's
participation was voluntary and subjects could exempt themselves at
any time. The time it took each participant to take the survey is
about 20 minutes. Each participant was acknowledged and thanked for
their participation in the study. Data Analysis After the survey was
completed, results were transferred into a Microsoft Excel
spreadsheet and sorted through. Participants were sorted into two
groups; with one group being individuals who were 18-39 and another
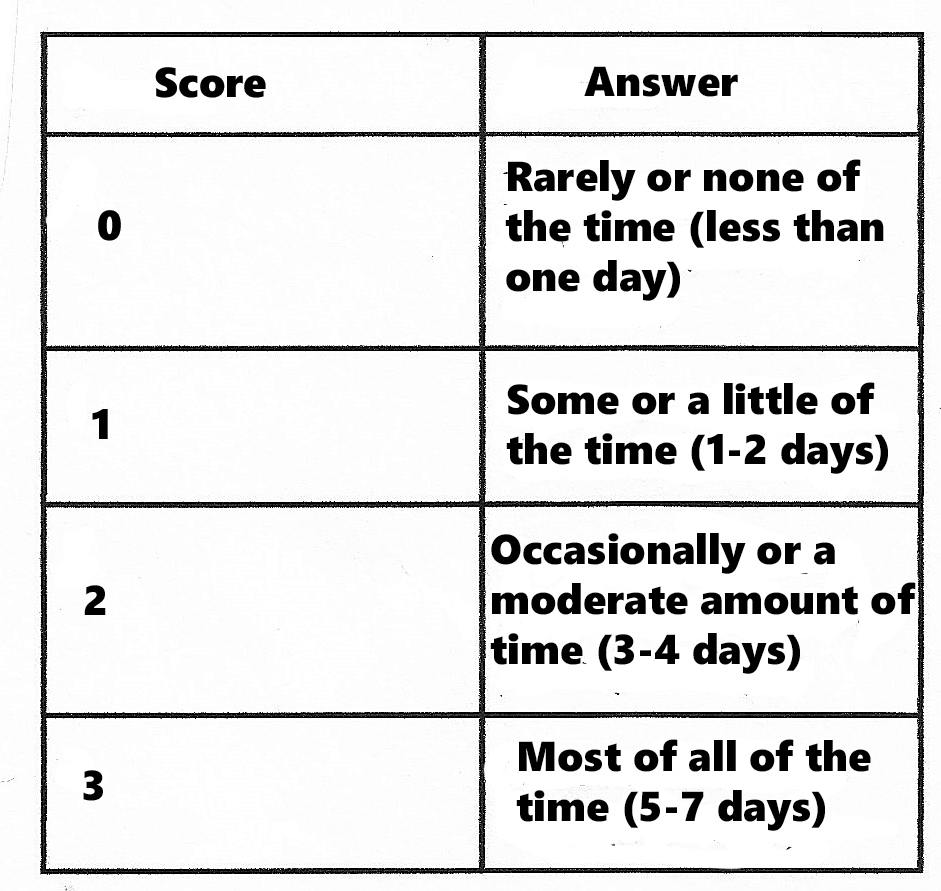
who were 40 and up. Each answer for each participant was scored
numerically. The numerical range of answers ranged from 0-4.
Afterwards the sum of each participant's question on a scale of
1-60, with 60 being a relatively high feeling of depression and l
being low, was recorded. |
Data Analysis
After the survey was completed, results were transferred into a
Microsoft Excel spreadsheet and sorted through. Participants were
sorted into two groups; with one group being individuals who were
18-39 and another who were 40 and up. Each answer for each
participant was scored numerically. The numerical range of answers
ranged from 0-4. Afterwards the sum of each participant's question
on a scale of 1-60, with 60 being a relatively high feeling of
depression and l being low, was recorded. |
Table 1:
Gender
Pie Chart |
Table 2: Ethnicity of
Participants
Pie Chart |
What is
your Gender?
50 Responses |
What is
your Ethnicity?
50 Responses |
 |
 |
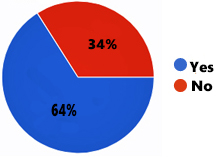
Quarantined
Pie Chart |
Table 3:
Coding
System |
Were you
Quarantined?
50 Responses |
Analysis |
 |
 |
|
|
|